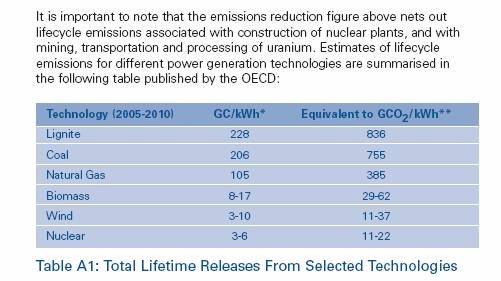
 The figures quoted above come from the OECD. The following links were supplied in a note to me by my colleague David Bradish:
First link is from the IAEA (pdf). If you go to the third page you can find a graph that visually explains the results.The point here is pretty clear: Always check your sources.
Here's a link to the WNA and if you scroll down two thirds of the way you can find a Supplement critiquing the source [Helen] Caldicott uses.
Here's another link from a non-nuclear source on the lifecycle emissions of all fuels. If you go to page 37 you can find a bar chart displaying the results.
Here's another link to a University of Wisconsin-Madison study. If you go to the top of page 92 you can find a paragraph of their conclusions.
Technorati tags: Nuclear Energy, Nuclear Power, Electricity, Environment, Energy, Politics, Technology, Economics
0 comments:
Post a Comment